During the test, participants' eye movements are recorded by Tobii 1750 Eye Tracker and analyzed with Tobii Studio software.
Click here to read the article about our studies on the topic of usability and human computer interaction written by Tobii.
The eye tracker collects data on where on the screen the participant looks, how long a fixation iis, how many times the participant looks at a certain point on the screen, and all the eye movements of the participant during the experiment is monitored. It also gives information about participants' attention, intention and intellectual state of the participant.
By means of these quantitative and visual data, it is aimed to make more efficient and effective interfaces.
Samples from Tobii Studio Outputs
After the study has been completed and the eye movements of participants have been recorded, the analysis is performed according to needs and aim of the study.
|
Figure-1 shows on e of the visual outputs of the participants' scan path, gaze time and fixations during the task completion process in the test. |
Figure -1 |
|
Figure-2 |
Another version of the data presented in Figure-1 is called as heat map (Figure- 2). In this map, the fixations are represented according to their time and number as a degrading pattern (red colur represents the areas which are looked longer and most). By means of these output, at a first glance, the information about the areas which the participants look most is obtained. |
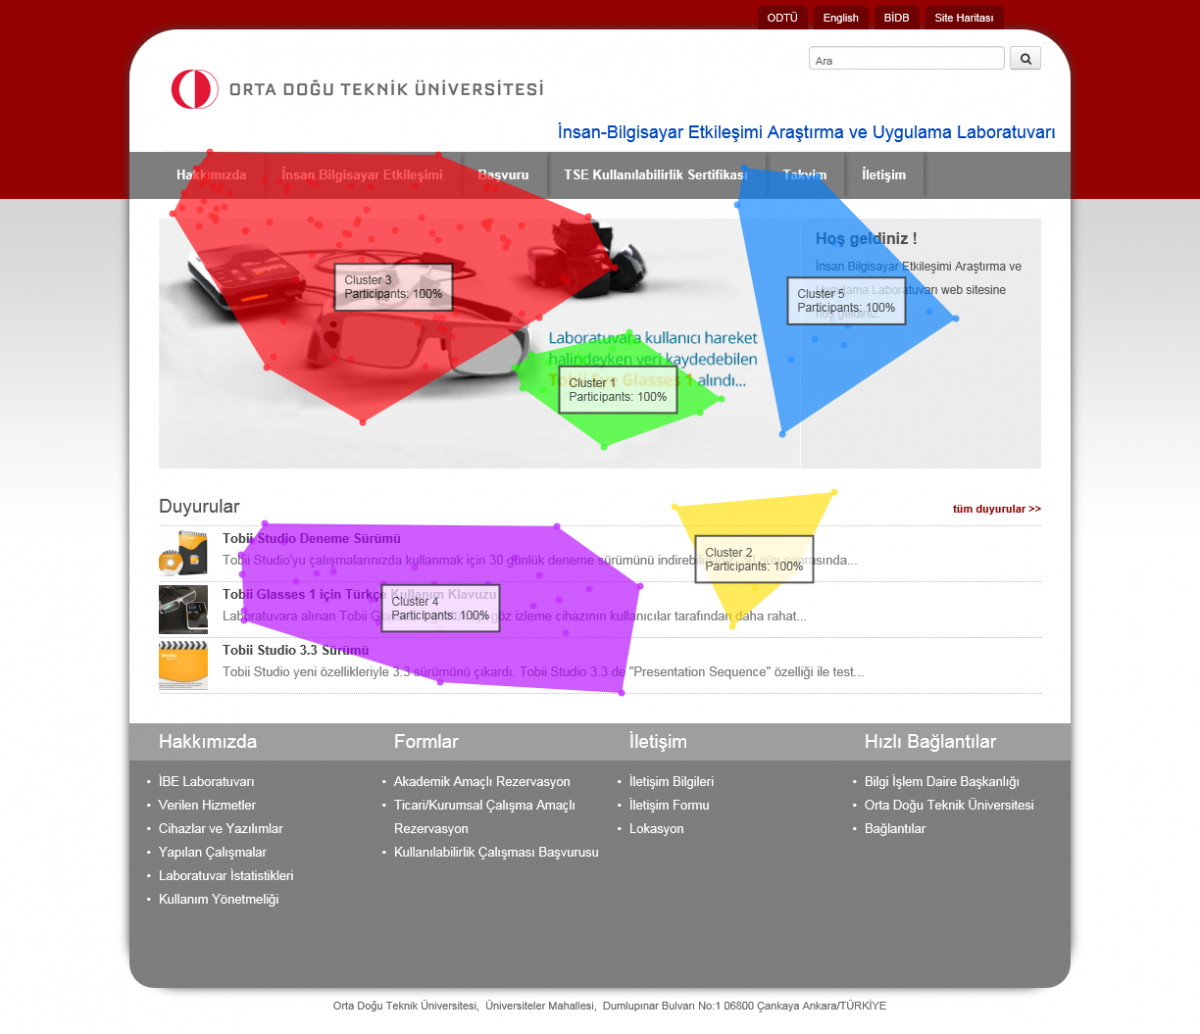
| According to density of fixations, the software makes clusters and create area of interets automatically. |
Figure-3 |
|
Figure - 4 |
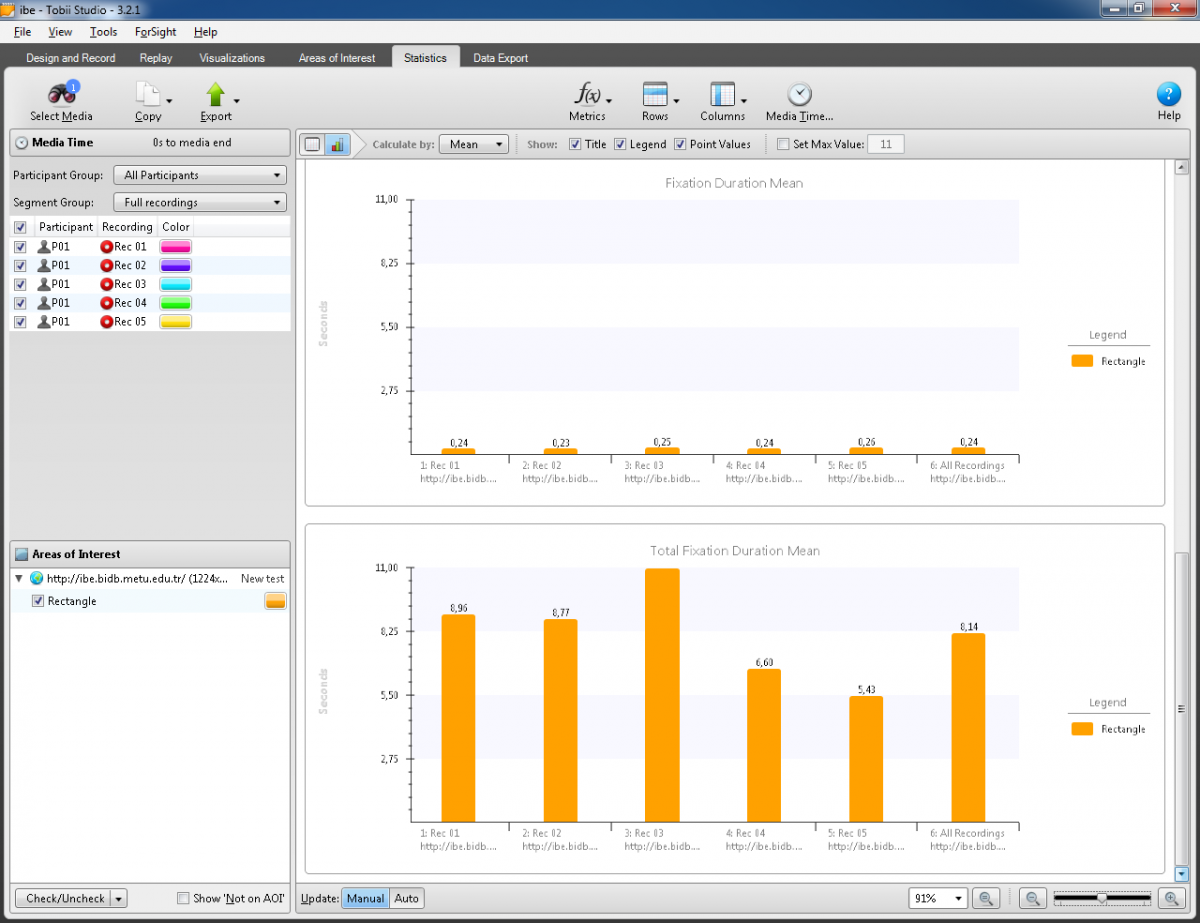
The visual data presented at Figure - 1 and 2 can be also analyzed as a quantitative data by using Tobii Studio software. Addition to this, it can be exported as a txt file in order to be used in a analysis programs like SPSS or Excel. The data which is presented as a table by the program is - Fixation time |
| It is also possible to obtain charts for all data presented in the table. |
Figure - 5 |
|
Addition to this data above, all data obtained by the eye tracker is able to be exported as a txt file. some of the most frequently used are; - Duration of each fixation |
|